
Nature Technology
Dashboards & Reporting Tools
Interactive dashboards and reporting interfaces that make complex environmental data usable for teams and stakeholders.
Overview
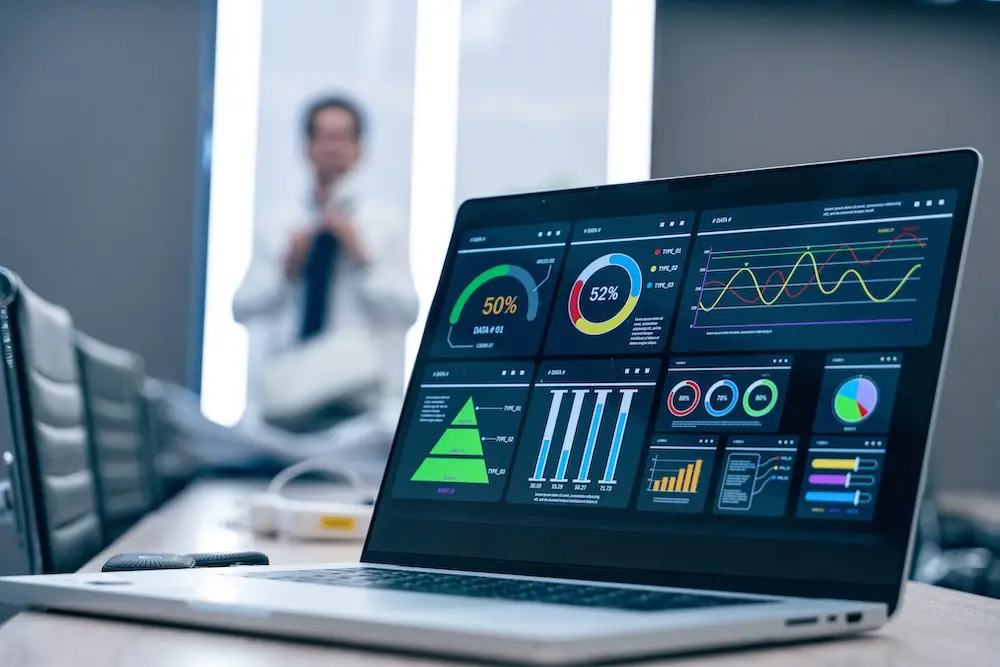
A dashboard fails when it shows everything and explains nothing. Environmental data are only useful on screen if the person looking at them can answer the decision they opened the tool to make.
How we approach it
We design reporting around those decisions and those users: an ecologist checking a season's data, a manager preparing a disclosure, a partner who should see a subset. Filters, comparisons and exports are part of the design. The tool can sit on data you already hold.
What we deliver
- Dashboard and report design tied to specific users and decisions
- Interfaces for filtering, comparing and exporting evidence
- Views for operational teams and for external stakeholders
- Implementation alongside an existing data platform where you have one
- Definitions so a number on screen matches the number in a report
- A short guide for the people who will maintain the views
What you receive
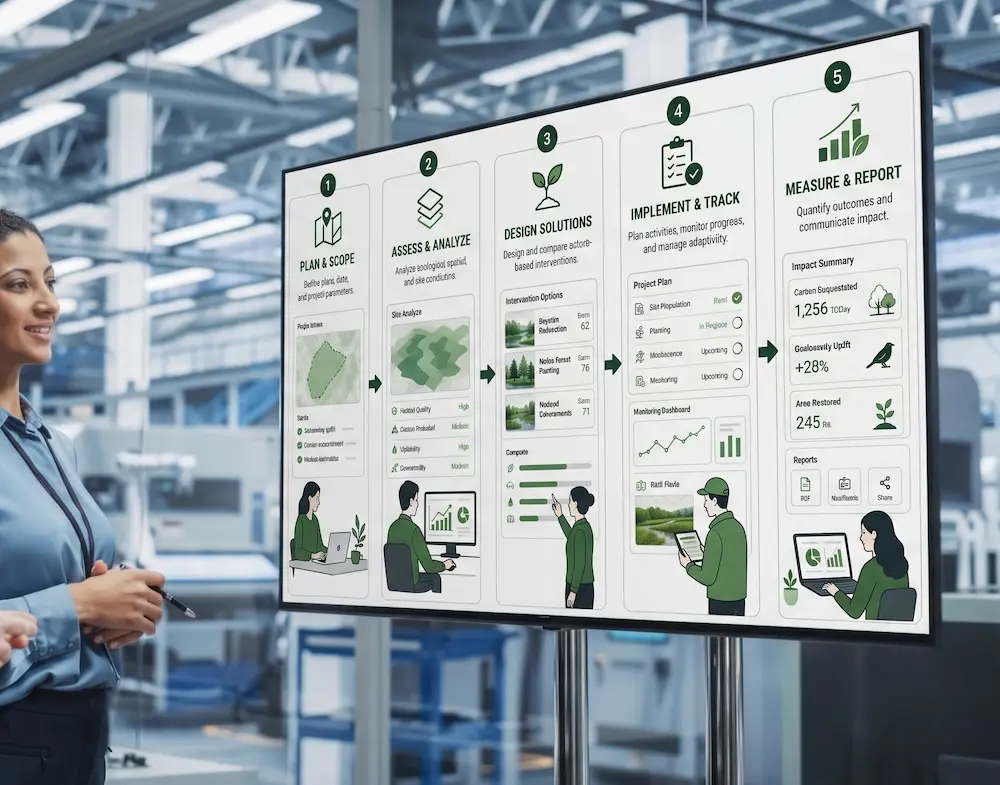
You receive a reporting tool people will open because it answers a question, not because they were told to use it.
When you need it
Use this when the data exist but the people who need them cannot get a reliable answer without asking an analyst each time.
Related services
Sustainability Reporting
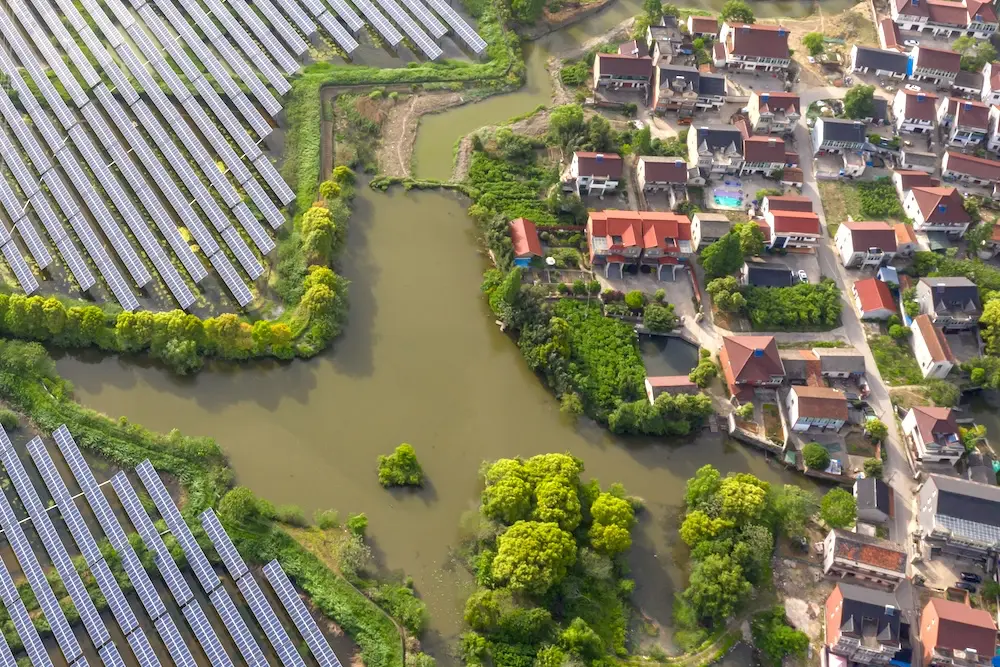
Reporting aligned to CSRD, including ESRS E4 biodiversity disclosure.

Software Platform Build
Bespoke environmental platforms built around your workflows, from data capture and analysis to dashboards, reporting and stakeholder access.
UX/UI Design
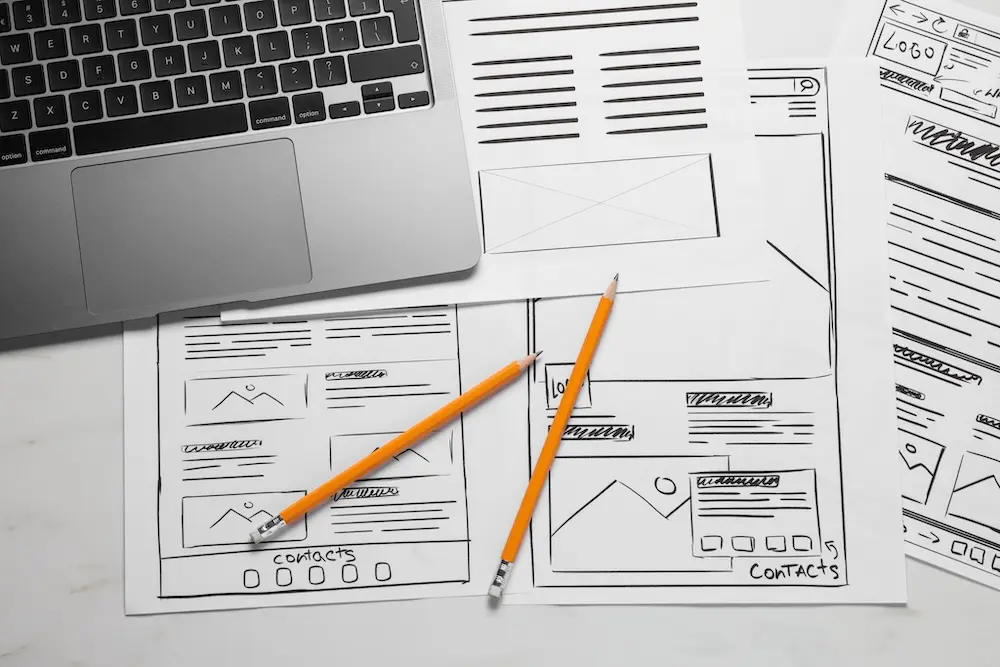
UX and UI designed around your environmental problems, with clear interfaces that help teams navigate ecological data, workflows and decisions.
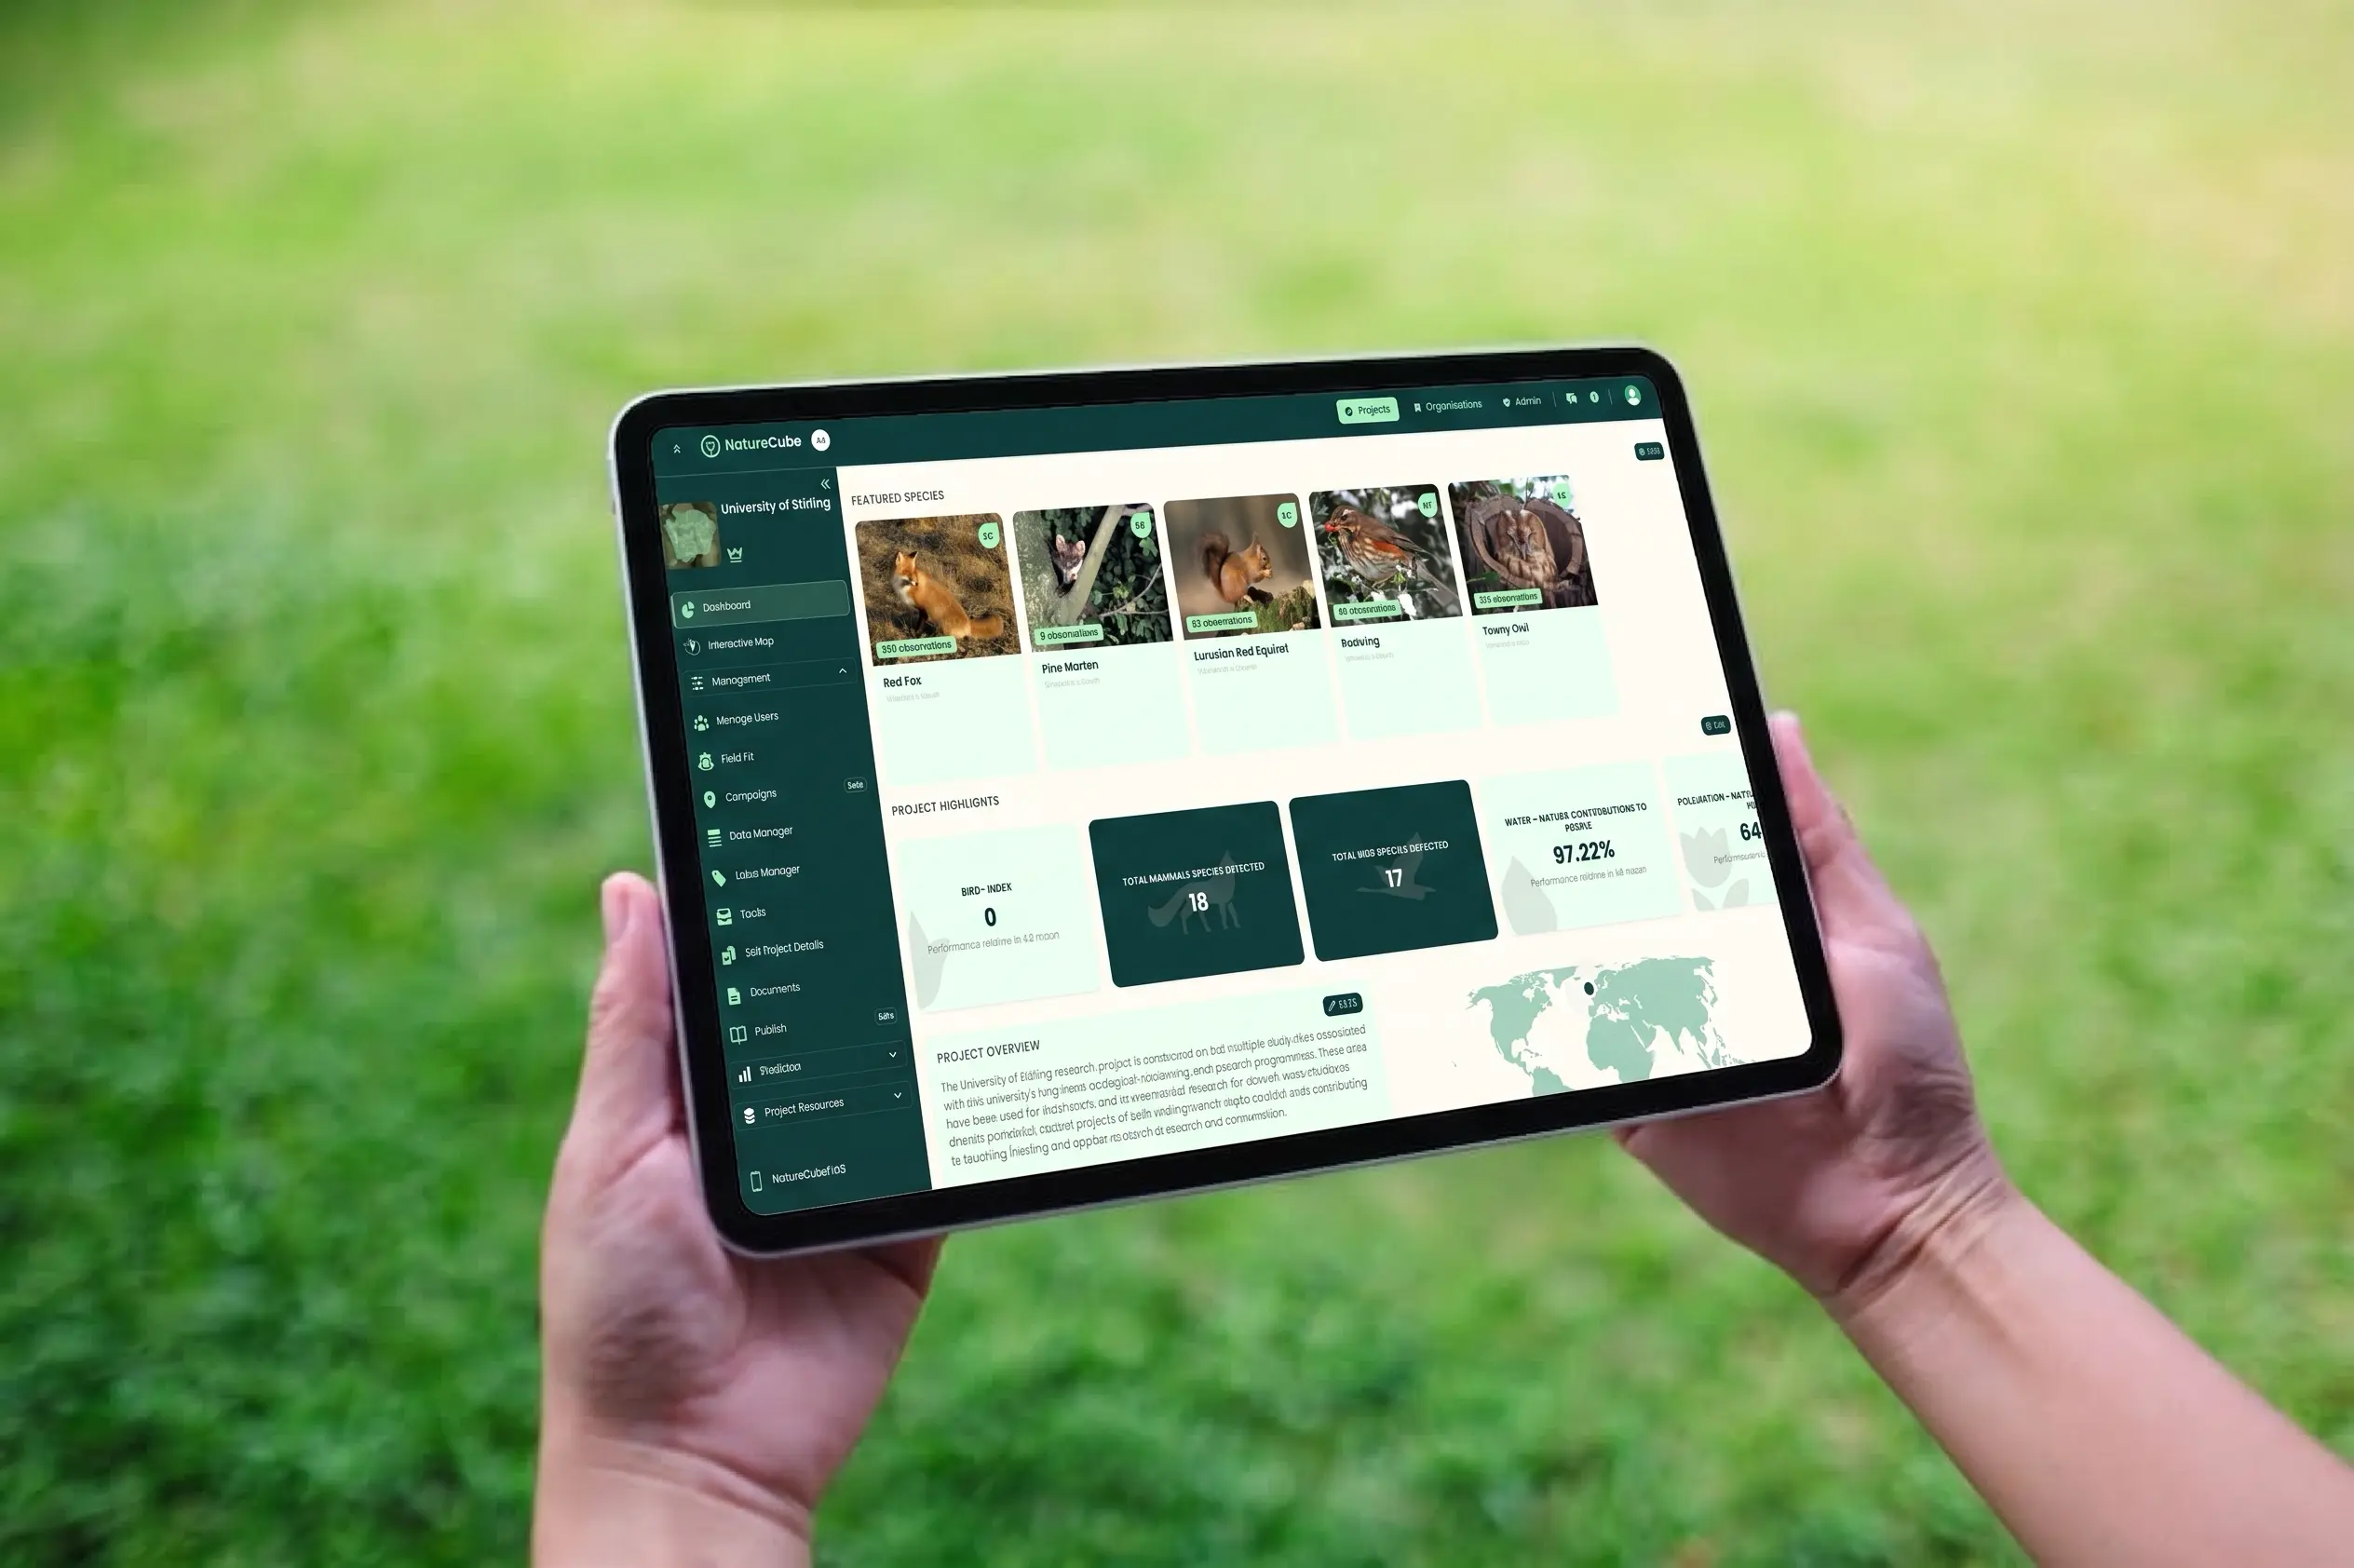
NatureCube Integration
Extend or integrate with NatureCube, Okala's platform for managing, analysing and interpreting complex biodiversity datasets.
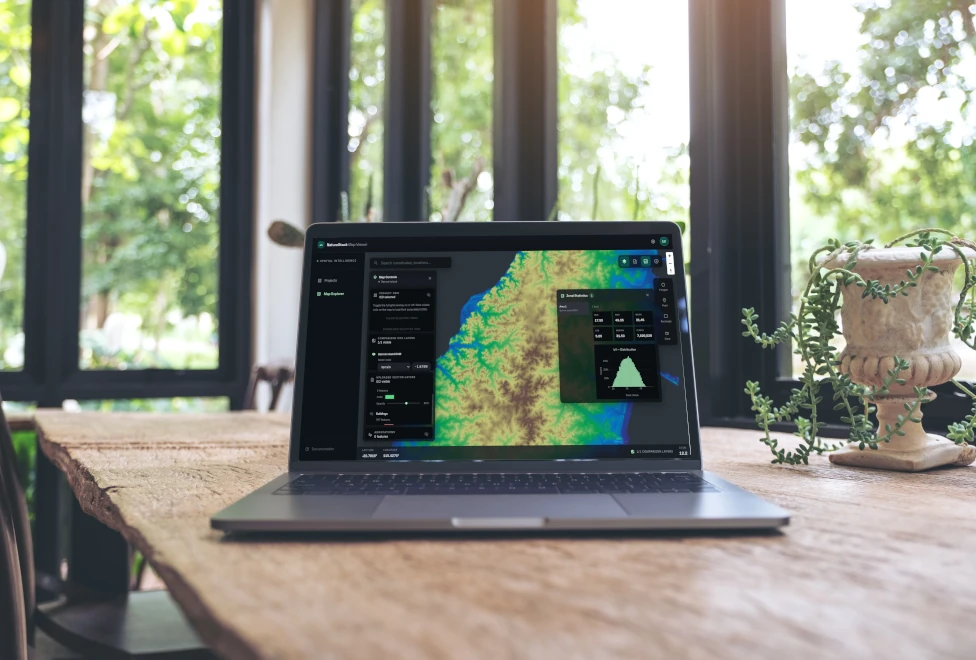
Geospatial Mapping
Mapping of land-use change, habitats and deforestation, delivered through NatureCube by our remote sensing and geospatial specialists.
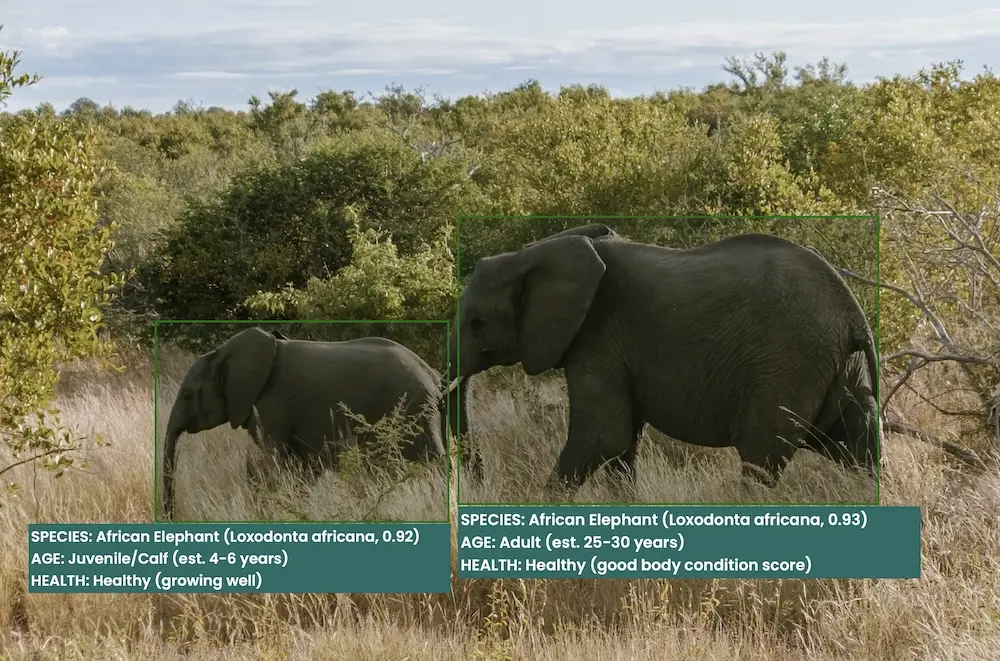
Custom Tools & Integrations
Custom AI models, data pipelines and integrations that extend NatureCube for your programme.